Keltner Channels
were developed by Chester W. Keltner. They were first introduced in
the book How To Make Money in Commodities, by Chester W.
Keltner and are explained in the book
The New Commodity Trading
System and Methodsby Perry Kaufman.
Keltner channels
as are Bollinger Bands and fixed width envelopes are� moving average
band.
Moving average bands and channels all fall into the general
category of envelops, which consist of three lines � a middle line and
two outer lines. Envelope theory holds that price has the greatest
probability of falling within the boundaries of the envelope. Price
falling outside the envelope boundaries is considered an anomaly and
therefore provides a trading opportunity. The major differences
between an envelope types can be found in the calculation of the
lines, in the spacing between the lines or bandwidth, and how they are
interpreted. Source: Stocks &
Commodities V17:12(533-538)
Construction of
Keltner Channels is simple. You have a mid band
based on the average of the high, low and closing price with a band on
each side formed from the 10 moving average of the daily high minus
the daily low. This would be represented as:
�������Average Price (AP) = (C+H+L)/3
������ Band
Moving Average = 10 Day Simple Moving Average (SMA)
����������� of (High � Low)
������ Middle Moving Average = 10 Day SMA
of AP
�������� Upper
Band = Middle Moving Average + Band MA
�������� Lower
Band = Middle Moving Average � Band MA
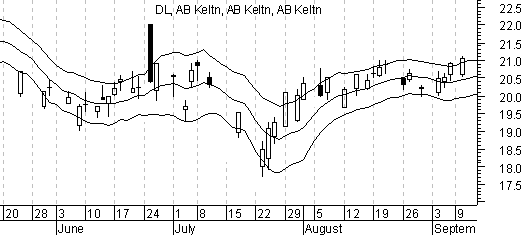
This can be
viewed in the below diagram.
DIAL
��Created in MetaStock
from Equis International www.equis.com
For those using�
Metastock�, the formula is:
Formula
#1: NAME: The
10-Day Moving Average:
FORMULA: MOV( (H+L+C)/3, 10, Simple )
Formula
#2: NAME:
Upper Keltner Band
FORMULA: MOV((H+L+C)/3,10,S) + MOV((H-L),10,S)
Formula
#3:
NAME: Lower Keltner Band
FORMULA: MOV((H+L+C)/3,10,S) - MOV((H-L),10,S) Source: Metastock
Interpretation
Originally, Keltner
had his system buy when the close exceed the upper channel and sell
when the close was below the lower channel. Basically, penetration exceeding
the channels showed a strong bullish or bearish momentum and
presumably the momentum would continue.
However, there is no reason why the Keltner Channel cannot be
interpreted the same way as other price envelopes such as Bollinger
Bands. When using Bollinger Bands ninety five percent of price
movement occurs within the bands. The upper and lower bands are
considered as extremes of the price movement and are a warning that
price exhaustion may be occurring. Buy signals occur when the price is
below the lower band and sell signal occur when price exceeds the
upper band.
Recommendations
I prefer using the Keltner channels with a 10 day exponential average.
And I would use other indicators such as Stochastic, MACD, RSI or
Williams %R to confirm overbought and oversold conditions.
References
and Additional Reading
Evans, Stuart (1999). Keltner Channels
Kaufman, Perry J. (1998).
Trading Systems and Methods
�