�Free
Newsletter Receive our weekly list of�
3 Day Hammer Stocks
Sell
With the
Moving Averages
Moving averages are one
of those trading tools that have gone to the wayside as we look for
ever increasingly sophisticated methods of trading. As in most things,
we tend to over complicate our trading and thereby "miss the forest
for the trees." Or we miss the real direction of the stock by paying
attention to the daily price fluctuations which may be nothing more
than random fluctuations of the price.
What we need to do is
pay attention to what the "Big Boys" are paying attention.
After all, they are moving the stocks and we need to jump in front of
them and be nimble enough to get out before they squash us. Forget
true
day trading. In and out in 5 to 10 minutes is not what I write about.
Day Trading is� for people who want to spend all day in front of
a screen. It requires ultra short time spans and nimble fingers are
more important than moving averages. I'm not against day trading and
several of my day trading colleagues make small fortunes. It's just
that my style of trading allows me to trade and still have time for
car pools and food shopping.
Three moving averages
are important to the institution crowd and their individual importance
is in relation to your time horizon. What they are:
20 or 30 day MA for
short term traders
50 day for intermediate
traders
200 for long term
traders
What is important to
note is that most up trending stocks will pull back to
to a moving average. This is telling you that a stock is declining. You need to
determine if the decline is temporary or an indication that something
more serious is occurring.
The big institutions
will often jump in and buy a solid stock when it dips to its 50DMA.
This support sends the stock higher. If the stock moves slightly below
the average, it is probably OK to still hold it and wait and see
whether it finds support over the next few days.
What happens if the
funds don't start repurchasing? Without their buying power, the stock
will head lower. That's why you should sell a stock that moves through
its 50DMA on heavy volume. When it reaches the� 200 DMA this is
probably your last
good chance to bail out.
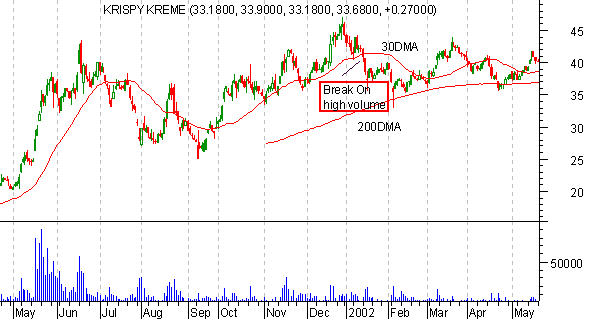
Krispy Kreme is an example. It dropped through the 30
day average. And while it did not plummet as did many of the internet
stocks, it went no where after the descent. So if you held on, you did
not significantly lose more money, neither did you make any money over
the next few months. Better to have booked the profit and move on to
more profitable stocks.
�
Krispy Kreme made new a new high in December. It then broke the 30DMA
on 1/14/02 with heavy volume. This was a sign that all was not well
and indicated that a selling of the position was indicated. Those
waiting to see if there would be a rebound got a second indication the
next day when KKD dropped on even larger volume. This was the end of
the ride in KKD. Although the stock rebounded off the 200DMA, as of
this article it never revisited the highs made at this point.